Anomaly Detection System
for National Gallery Singapore
in association with
Anomaly Detection System
Our Product
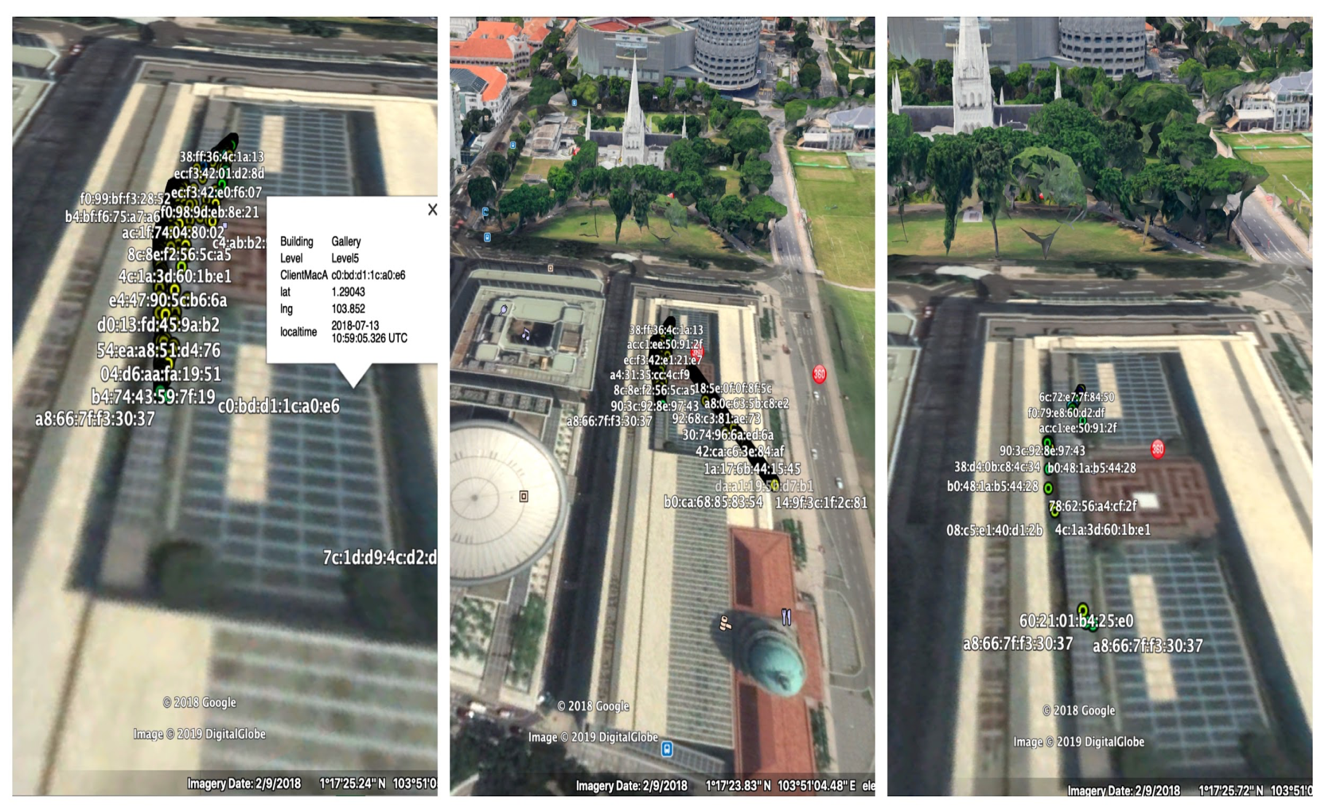
Team Vectors built an anomaly detection system to augment and strengthen the existing security system at National Gallery of Singapore. This system aims to track abnormal user trajectory pattern and act as an alert system to pin down possible misadventure or criminal activity inside the gallery.
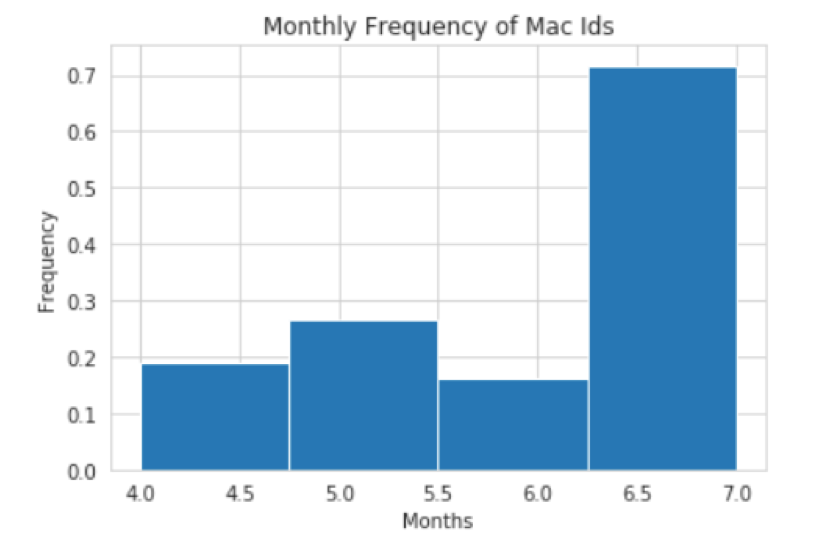
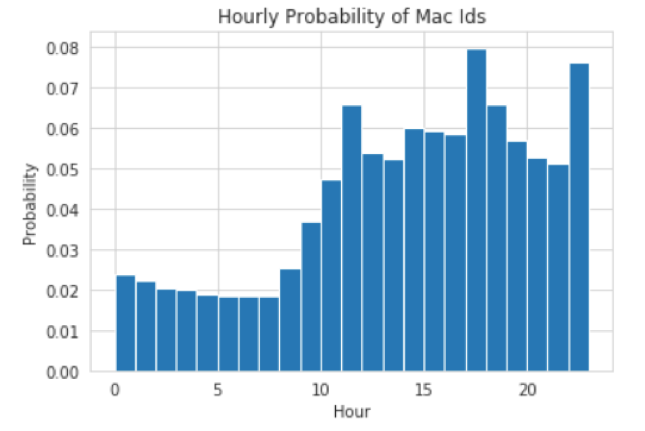
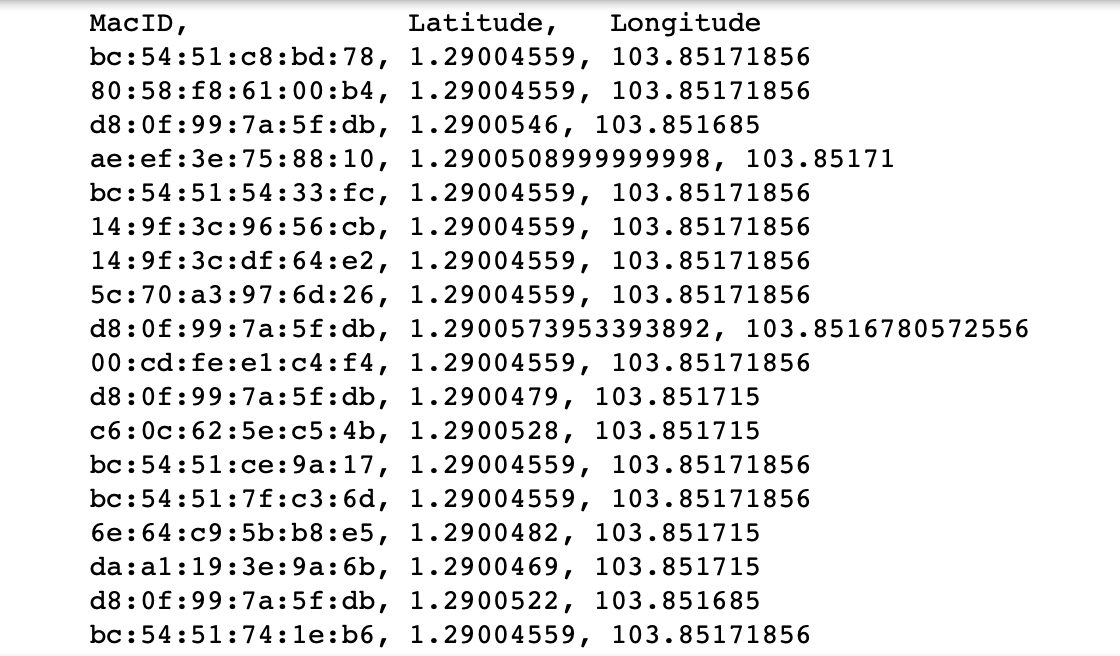
Understanding data
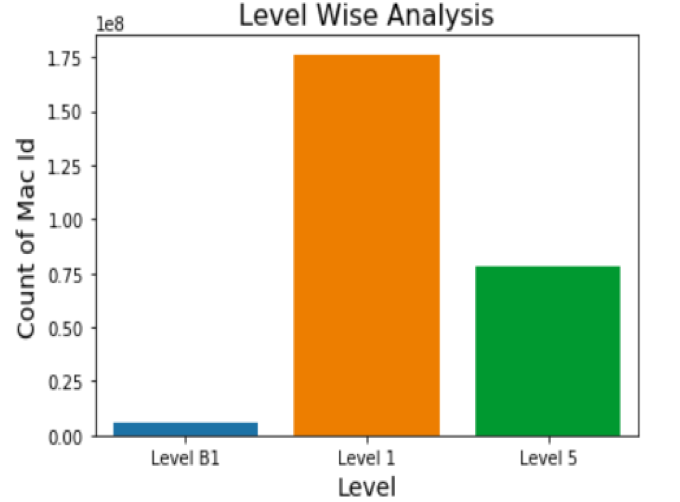
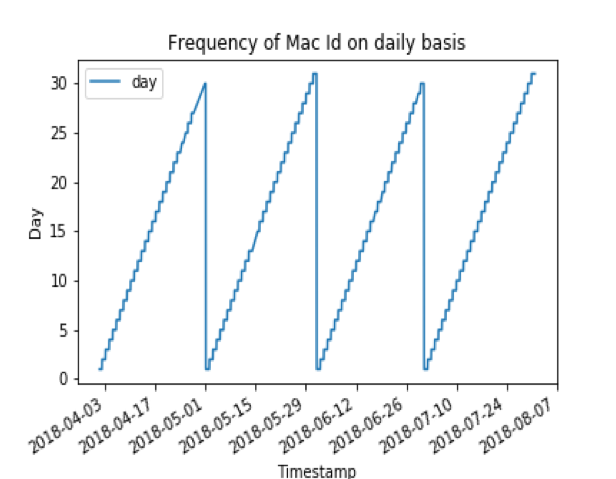
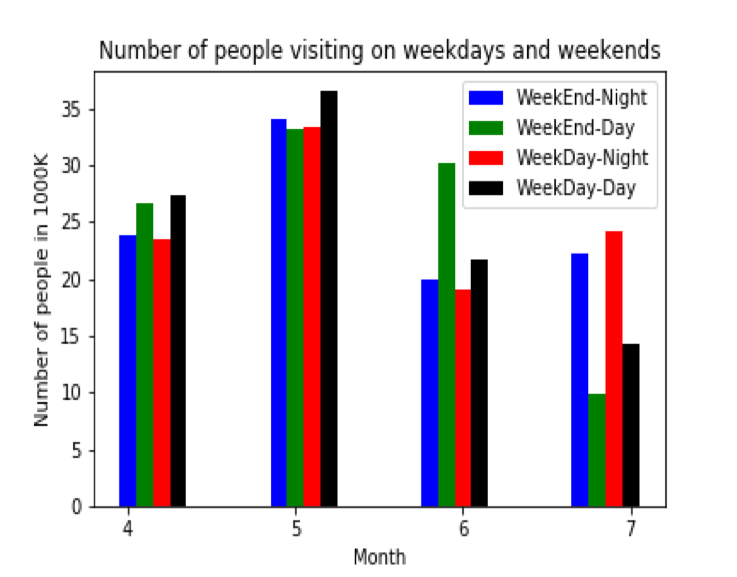
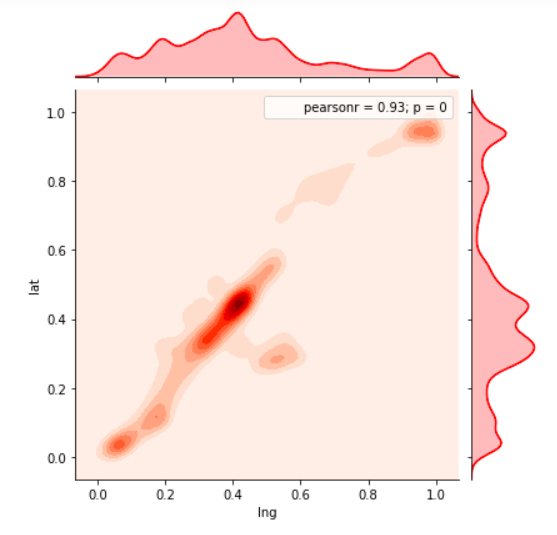
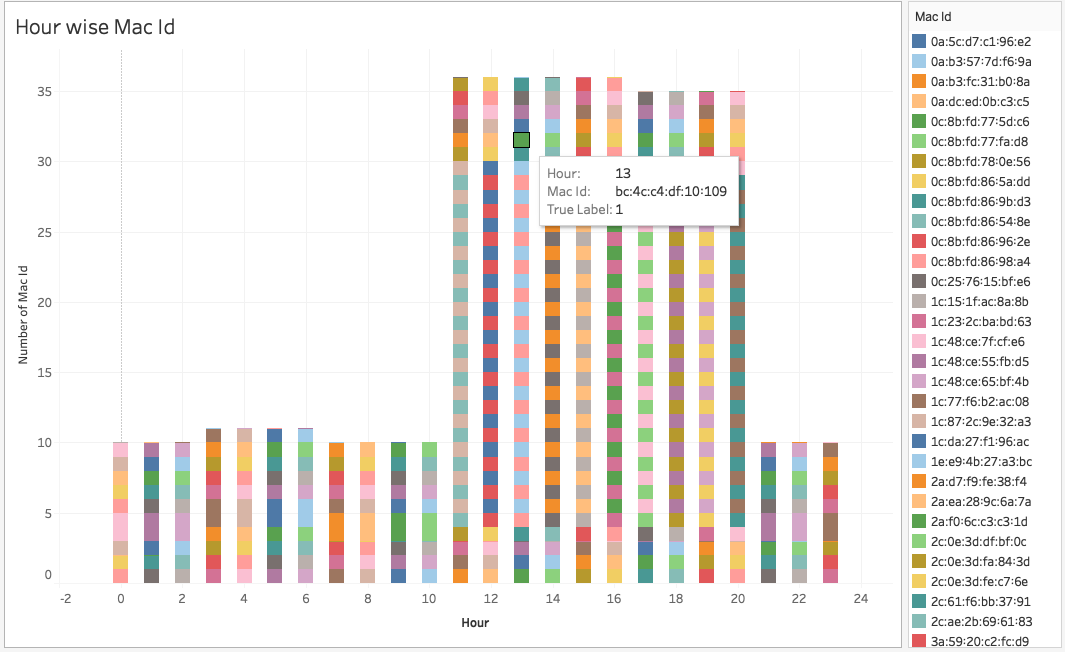
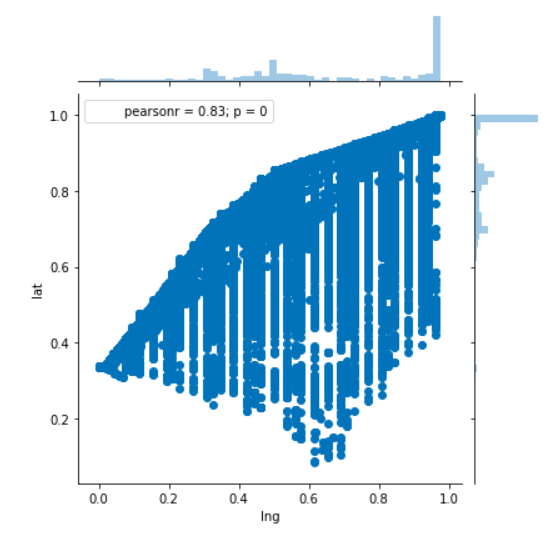
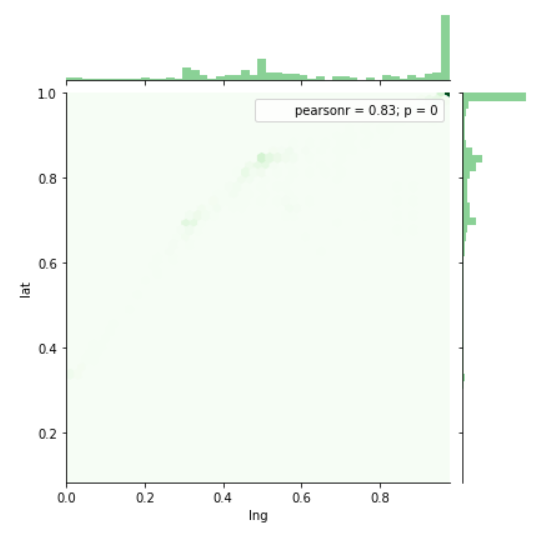
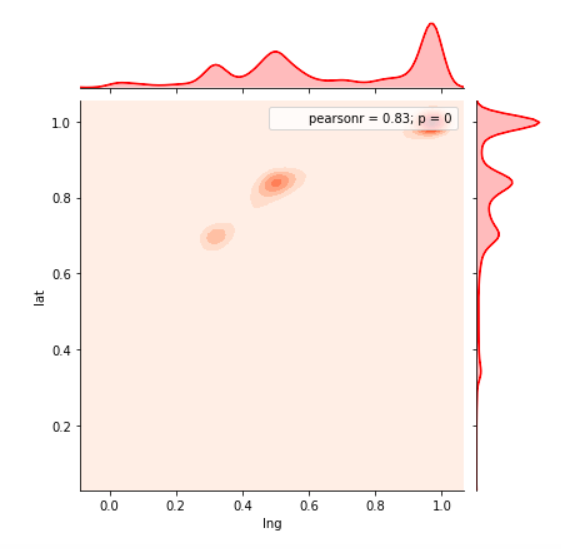
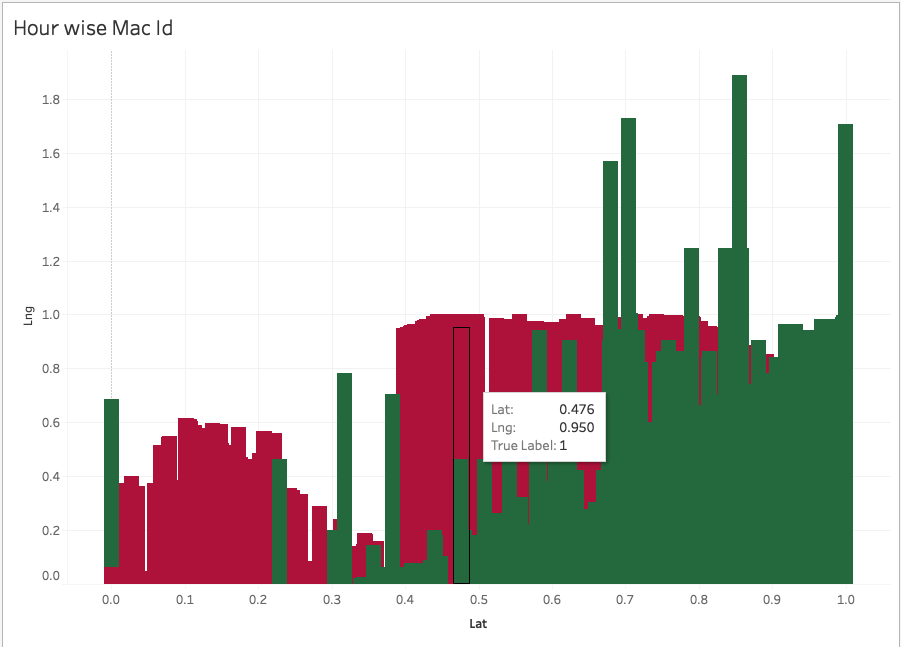
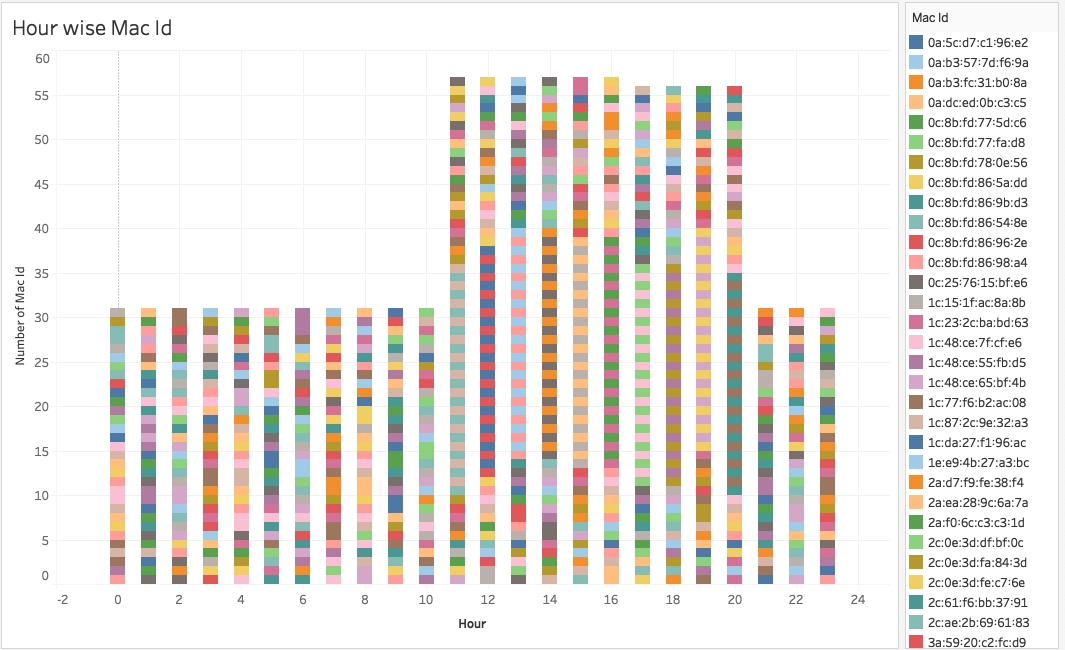
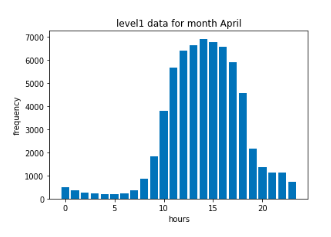
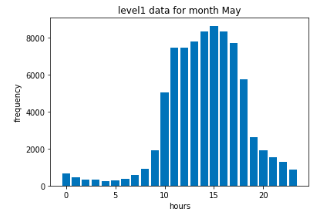
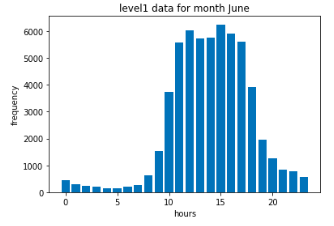
Exploratory Data Analysis
In statistics, exploratory data analysis (EDA) is an approach to analyzing data sets to summarize their main characteristics, often with visual methods. A statistical model can be used or not, but primarily EDA is for seeing what the data can tell us beyond the formal modeling or hypothesis testing task.
Gallery
National Gallery Singapore
Museum of Singapore and Southeast Asian arts housed in a restored municipal building dating to 1929.
About Gallery
National Gallery Singapore oversees the world’s leading public collection of modern art from Singapore and Southeast Asia. It comprises over 8,000 works from the 19th and 20th centuries in all media, including painting, sculpture, printmaking, photography and video.
Aiming to be the centre for research, discussion and publication on the modern art of the region, the Gallery offers wide access and fresh understanding of our unique visual art heritage.
With its comprehensive collection, the Gallery presents the development of Singapore and regional cultures to tell their social, economic and political histories. The Gallery looks beyond national and regional boundaries of art to include a wider ambit of international visual arts culture, research into Asian heritage and cultural affiliations, and engage with global cultures and discourses.


Implementation
Machine Learning Algorithms
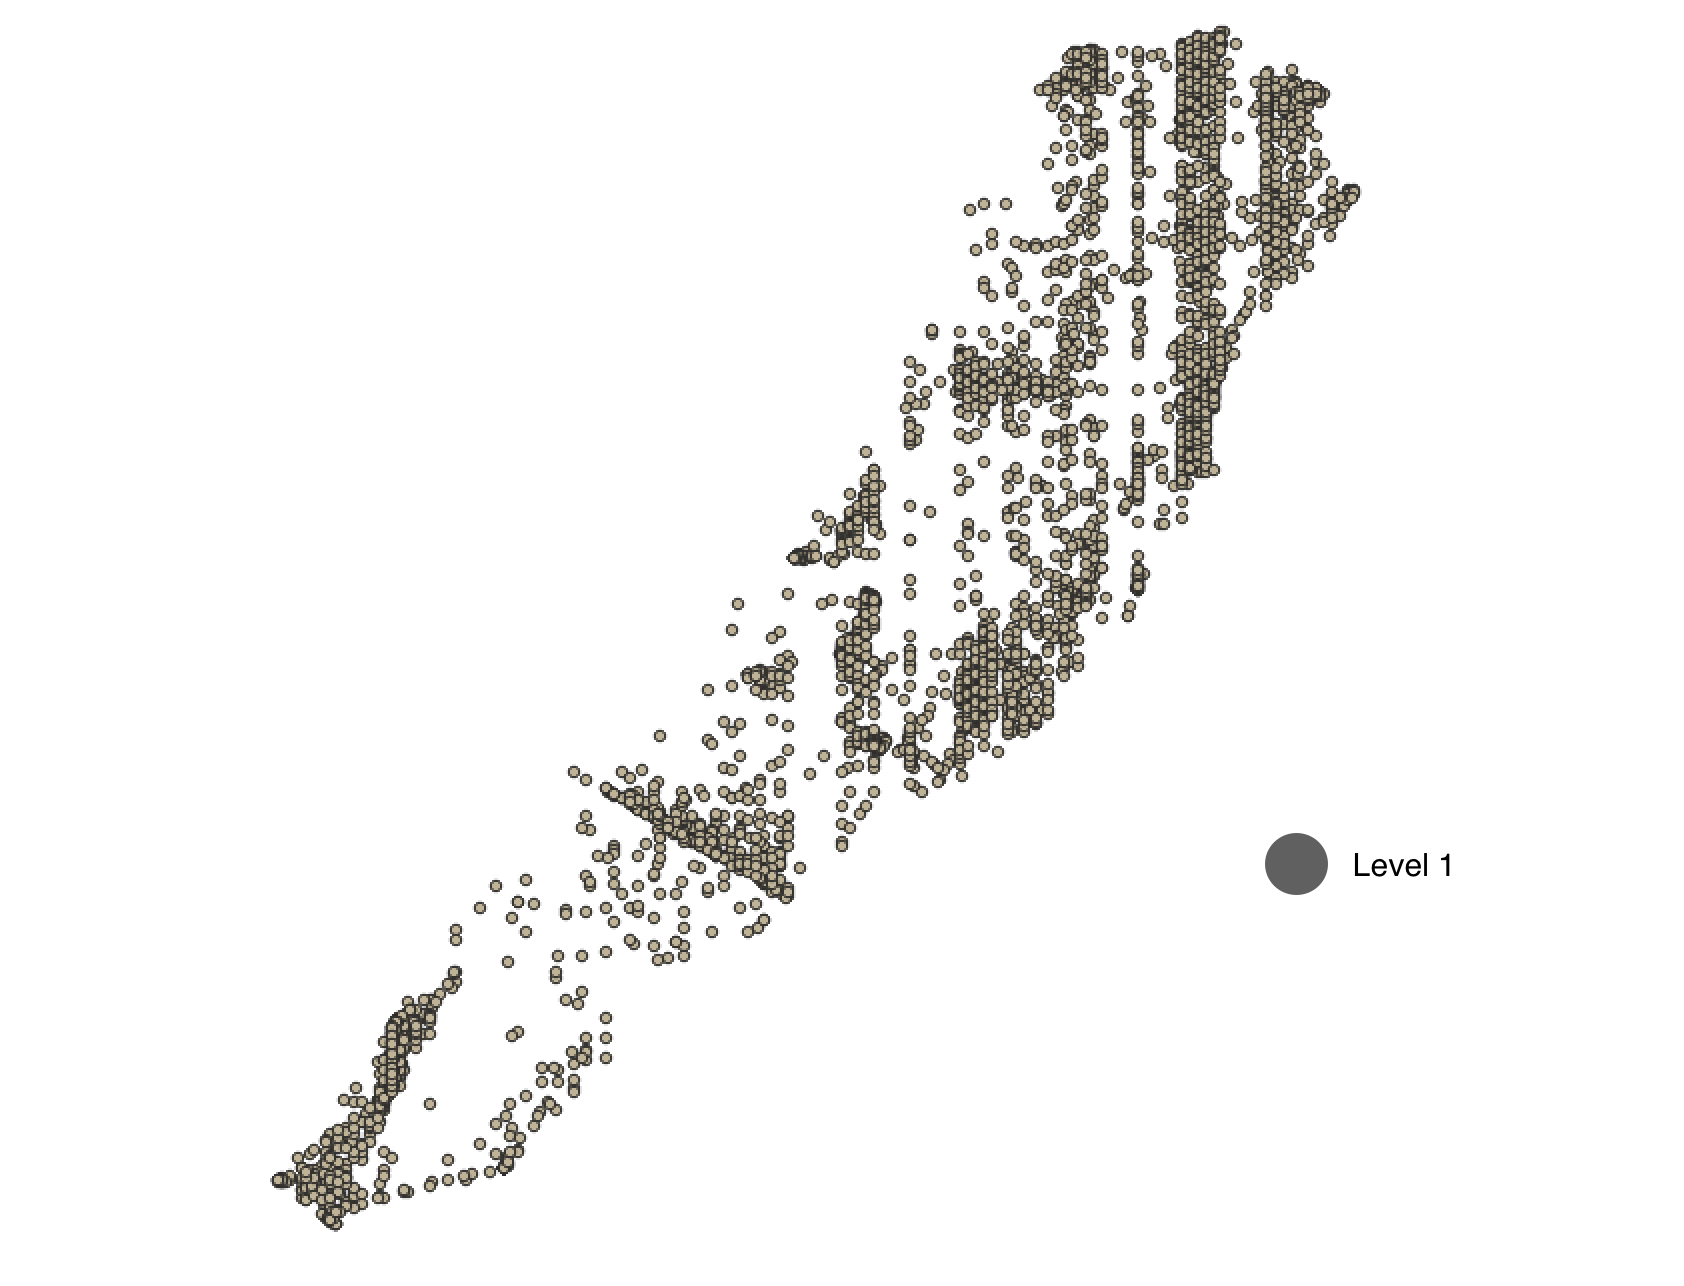
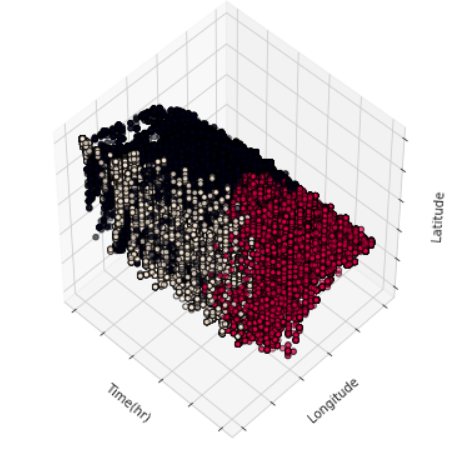
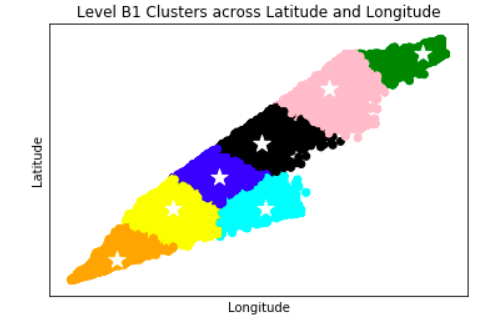
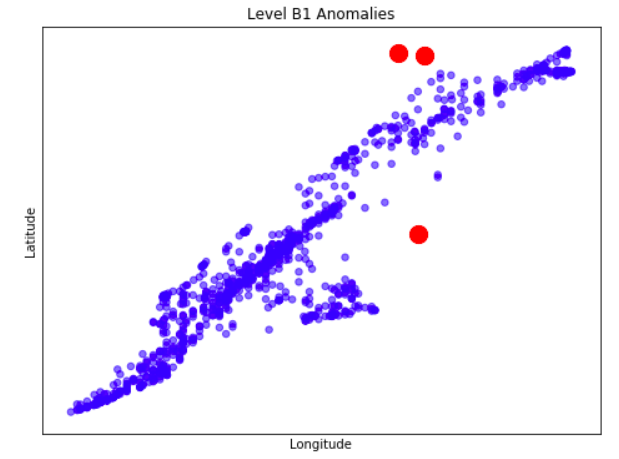
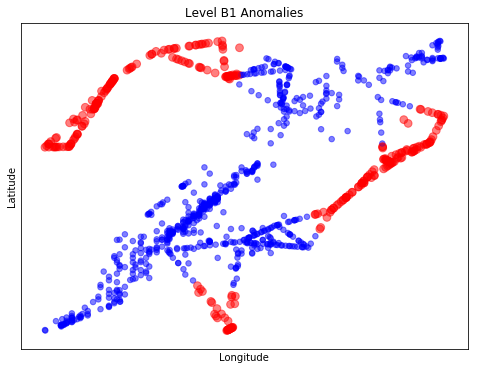
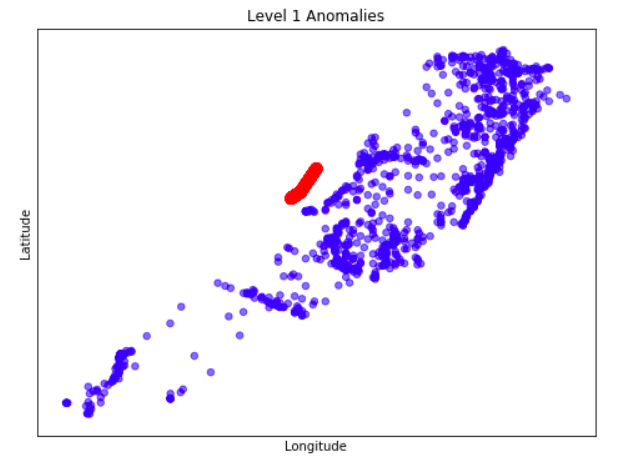
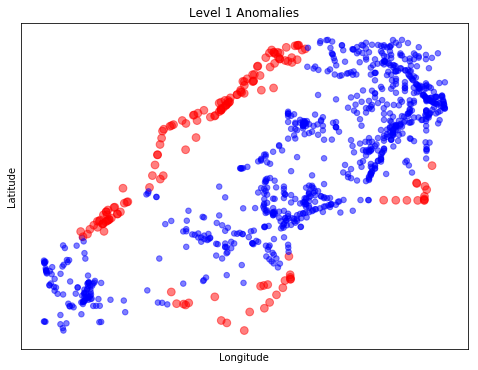
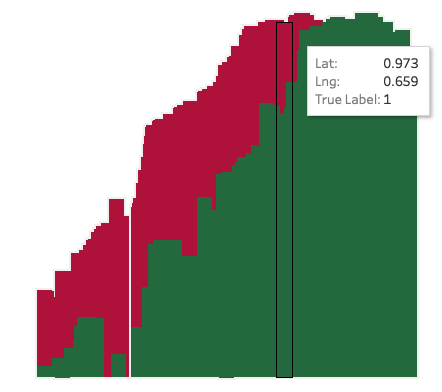
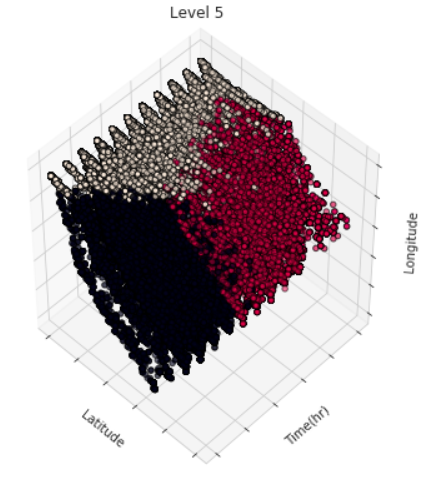
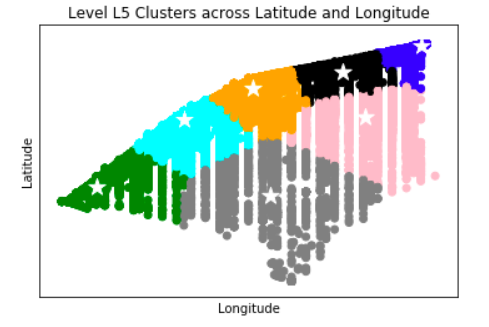
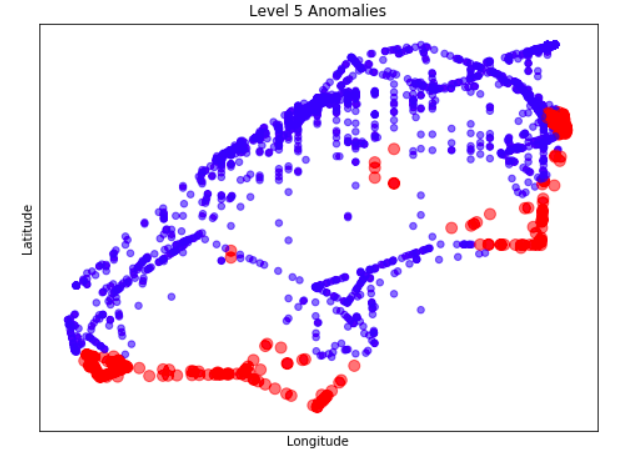
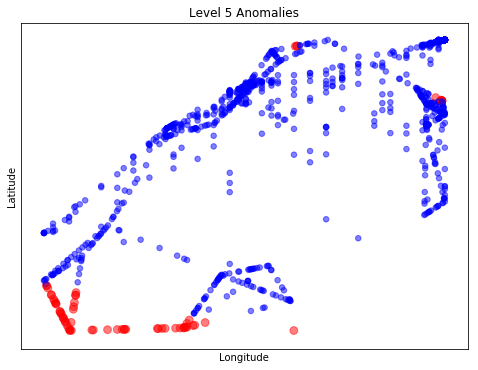
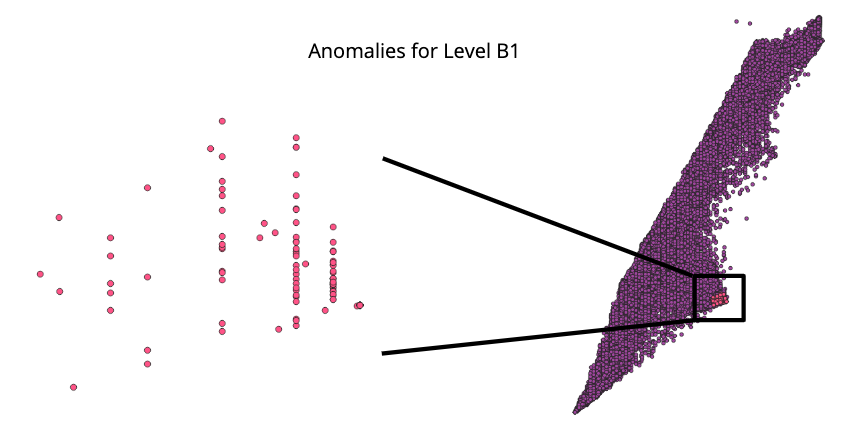
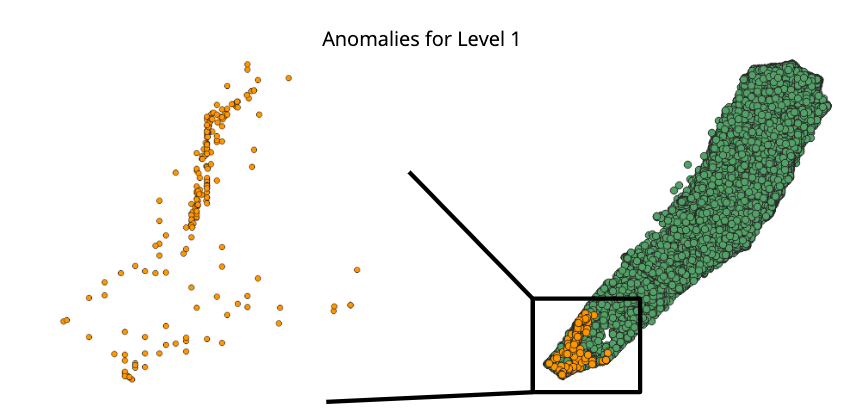
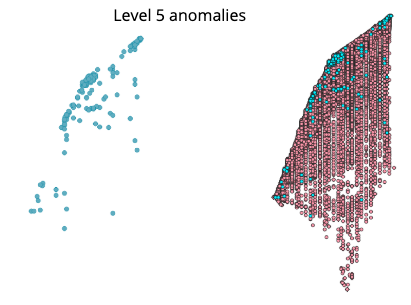
Anomaly is be defined as any deviation from standard pattern. We have implemented K-Means and GMM machine learning algorithms to detect cluster outliers in order to find out possible anomalies.
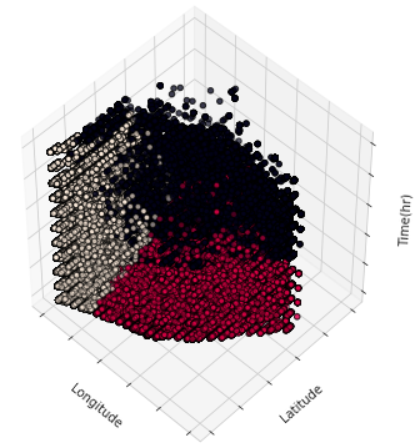
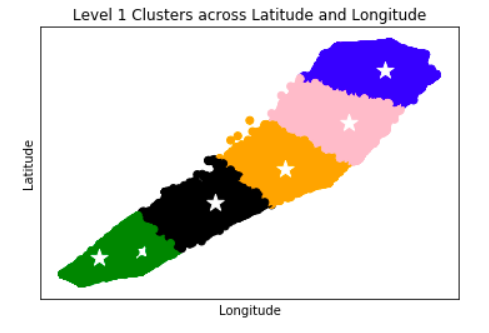
K-Means Clustering
K-means algorithm identifies k number of centroids, and then allocates every data point to the nearest cluster, while keeping the centroids as small as possible.
The ‘means’ in the K-means refers to averaging of the data; that is, finding the centroid. Every data point is allocated to each of the clusters through reducing the in-cluster sum of squares.
To process the learning data, the K-means algorithm in data mining starts with a first group of randomly selected centroids, which are used as the beginning points for every cluster, and then performs iterative (repetitive) calculations to optimize the positions of the centroids.
View Evaluation Results
| Silhouette Coefficient | CH Index | Davies Bouldin Index |
|---|---|---|
| 0.3462 | 271511.42 | 1.0021 |
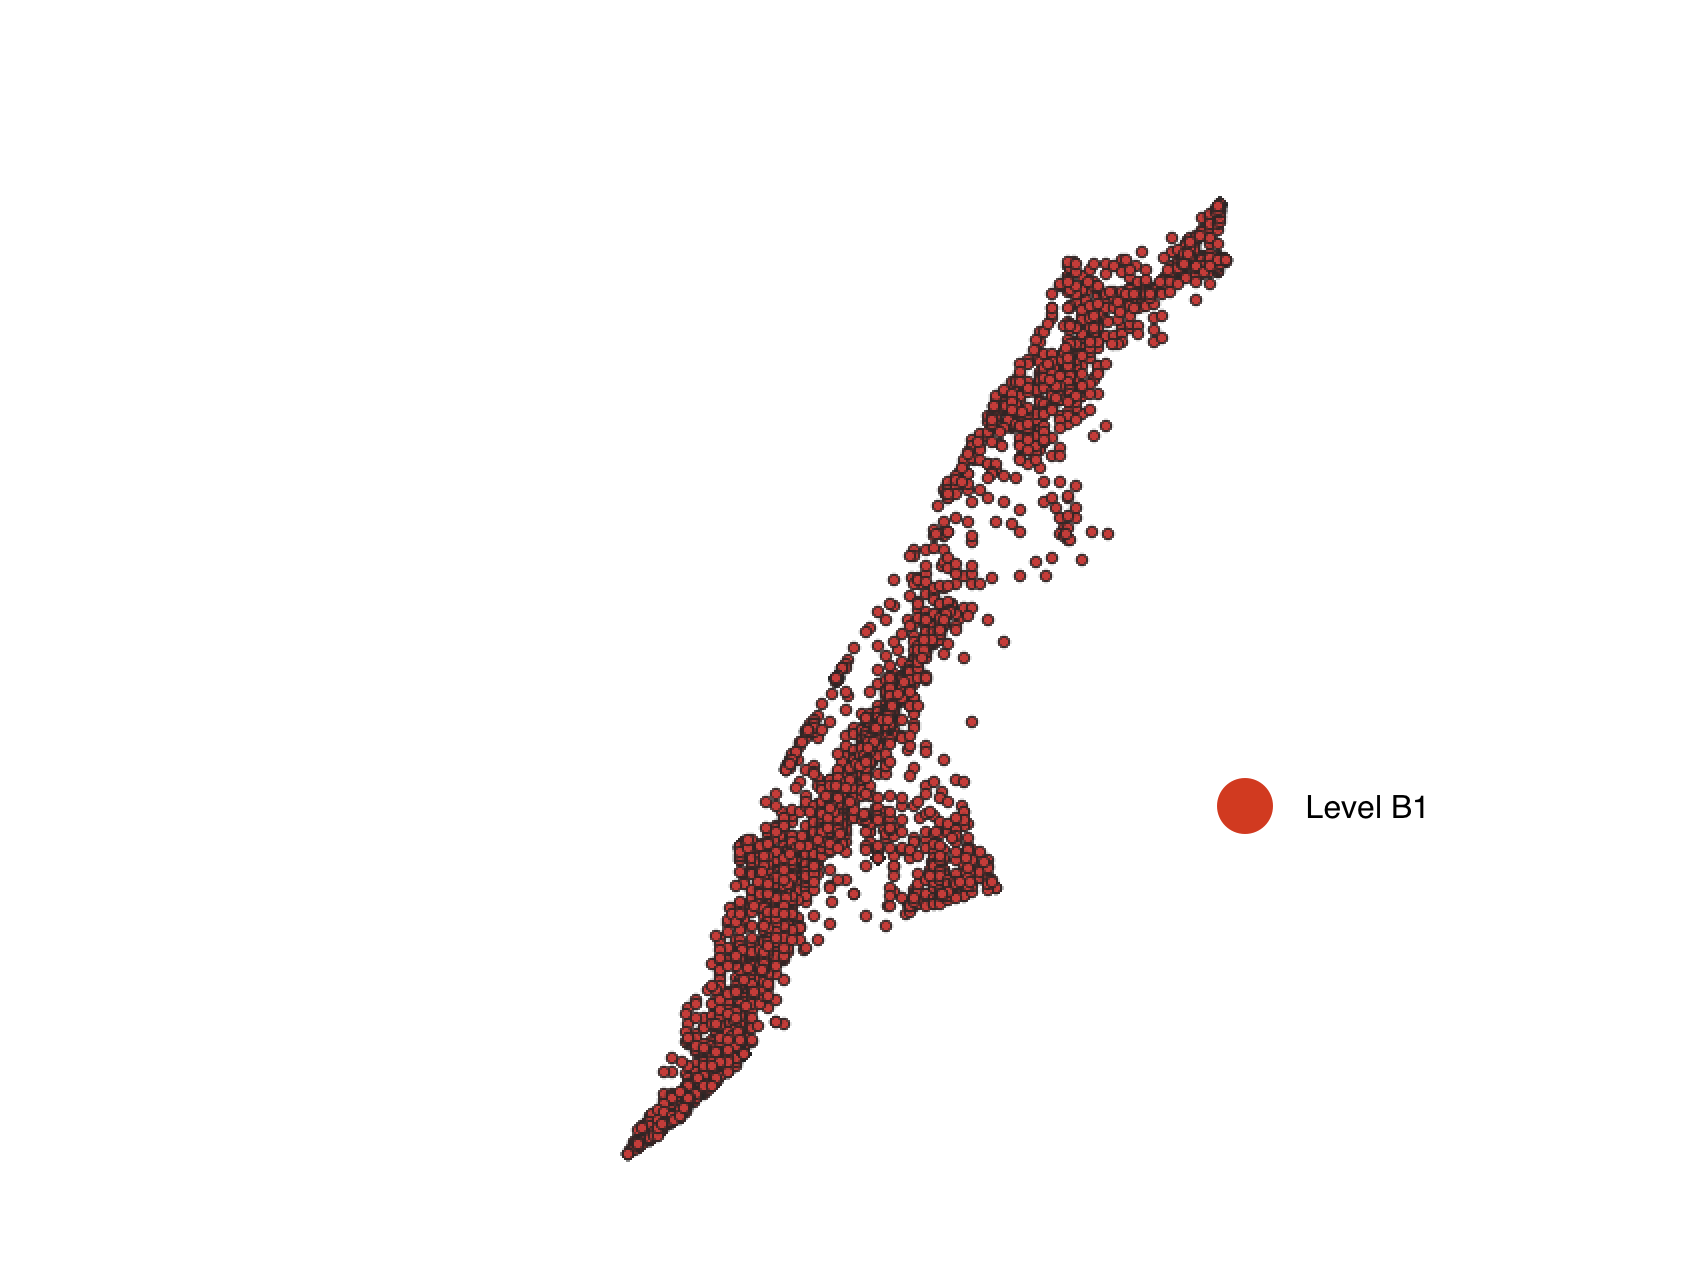
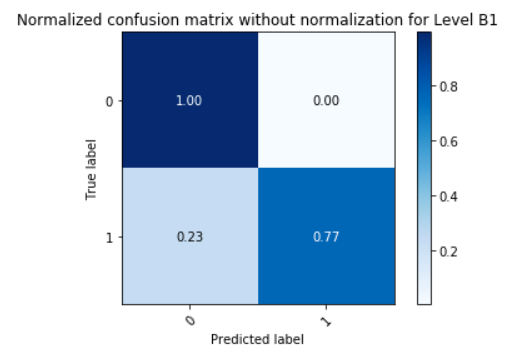
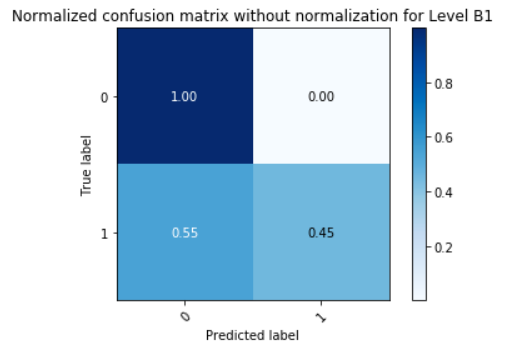
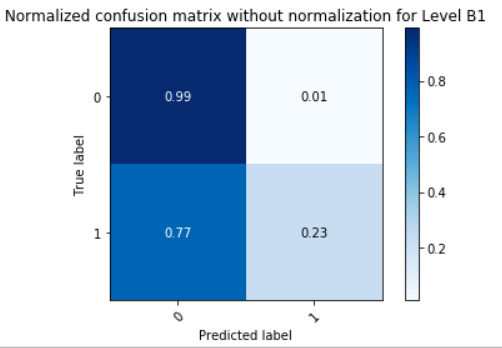
| Model | Accuracy | Precision | Recall | F1 Score |
|---|---|---|---|---|
| Model for Level B1 | 0.8810 | 0.9023 | 0.8810 | 0.8784 |
| Model for Level L1 | 0.7260 | 0.8210 | 0.7260 | 0.7041 |
| Model for Level L5 | 0.8085 | 0.9197 | 0.8085 | 0.7418 |
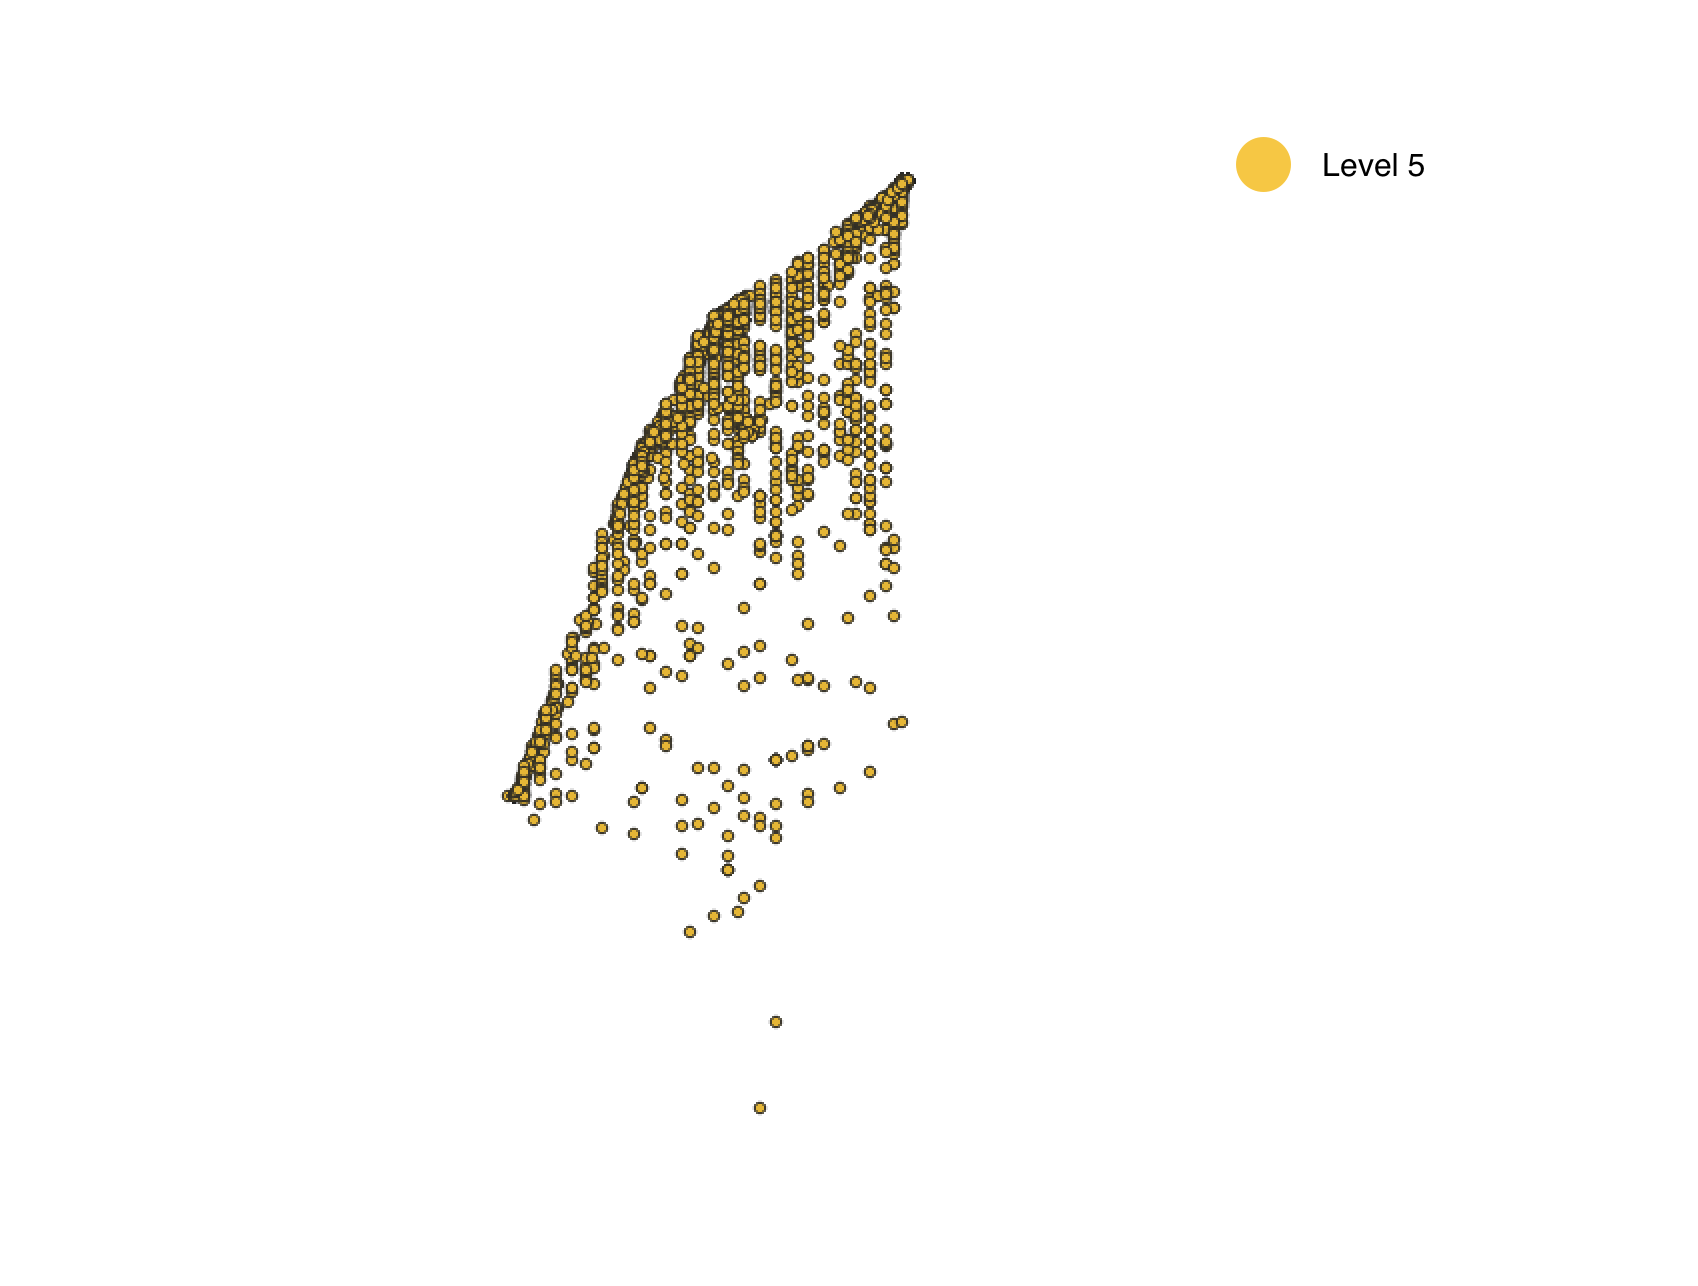
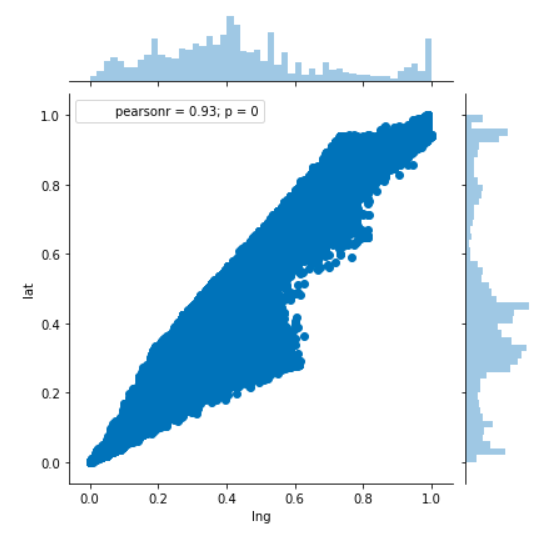
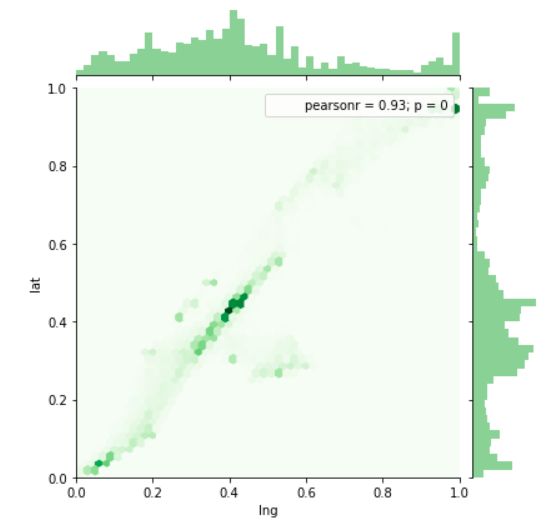
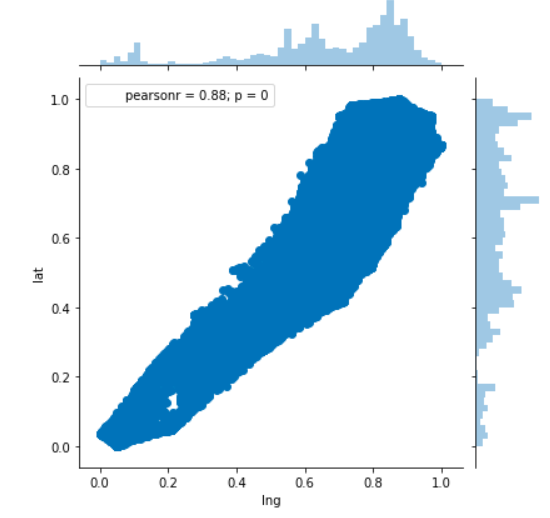
View Visualizations and Results
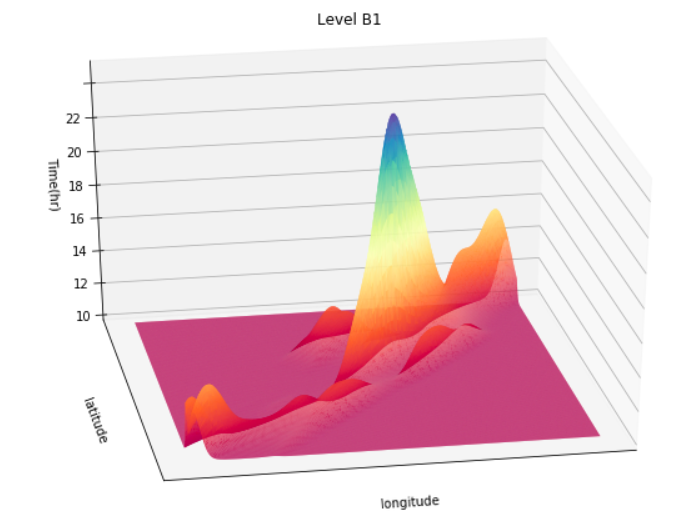
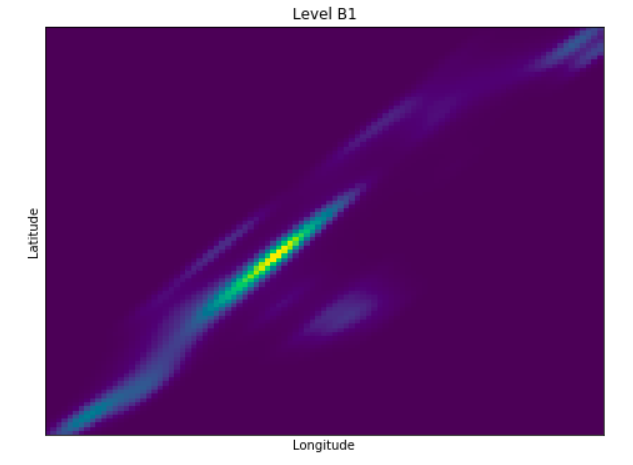
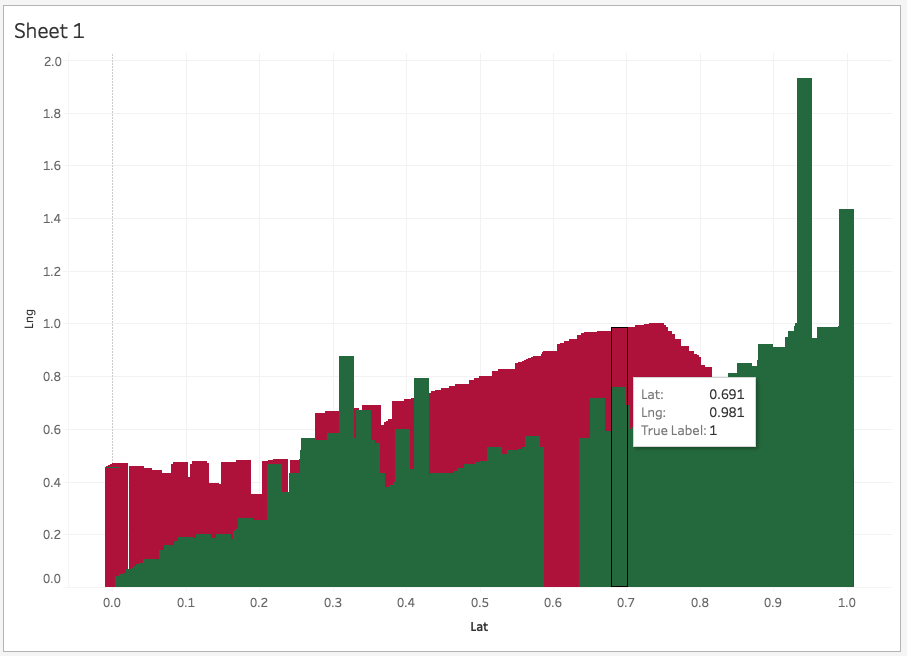

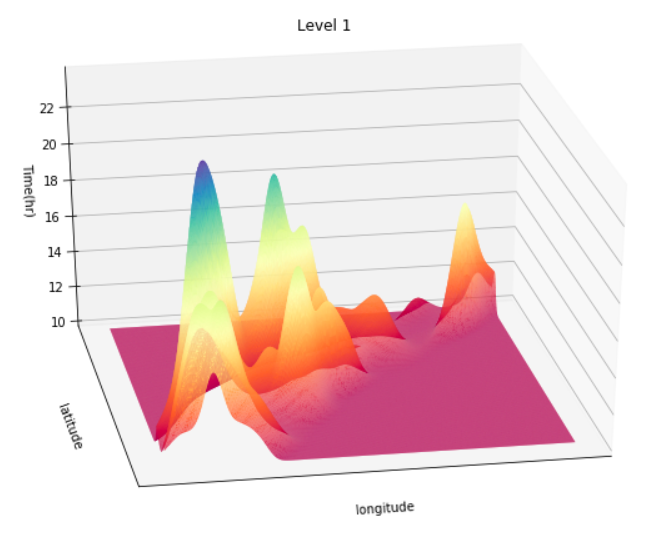
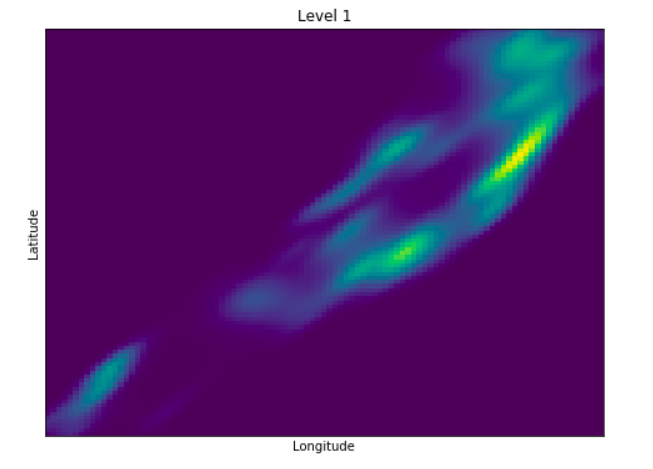
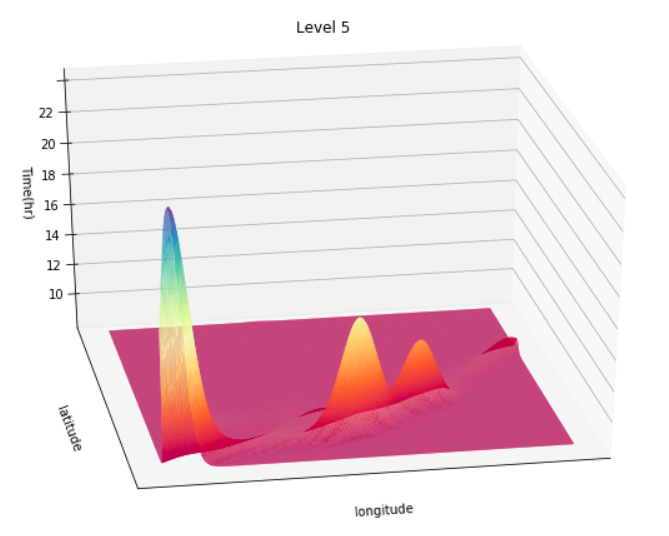
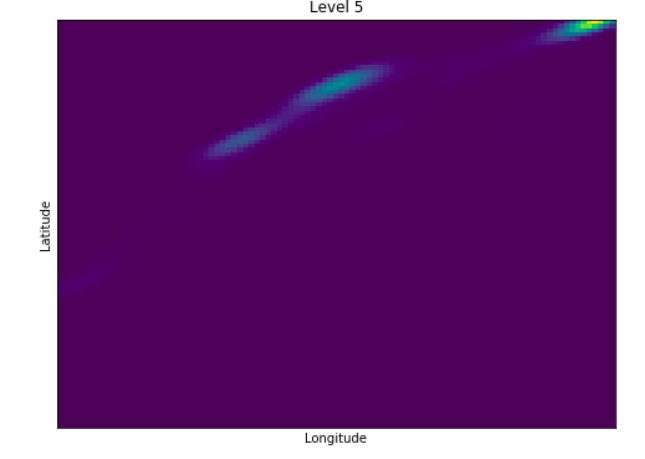
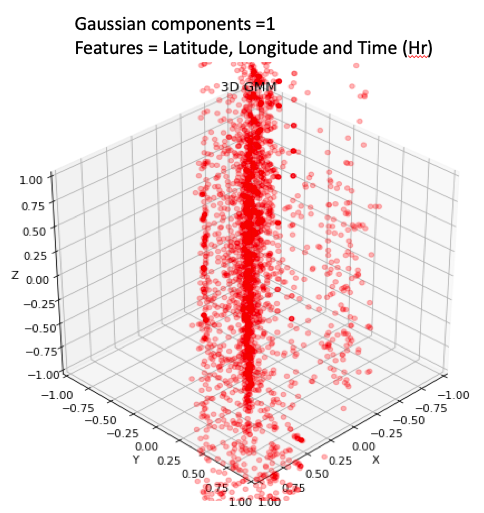
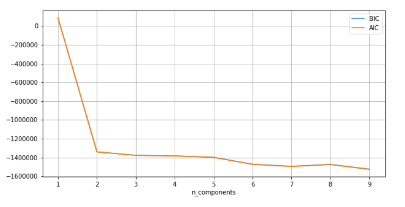
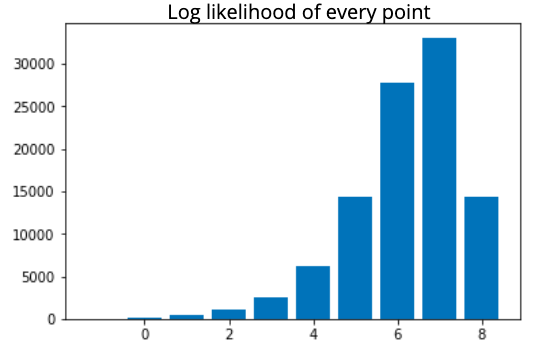
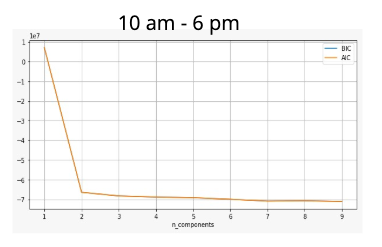
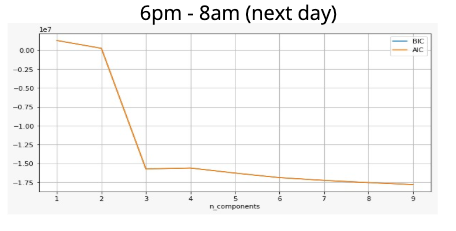
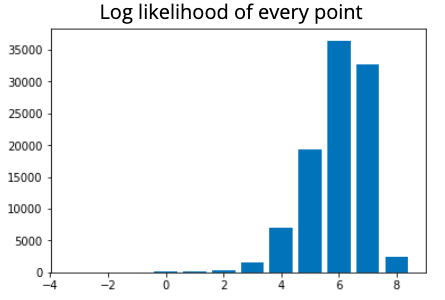
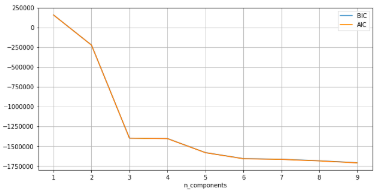
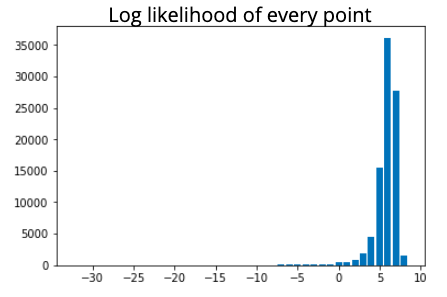
Gausian Mixture Models
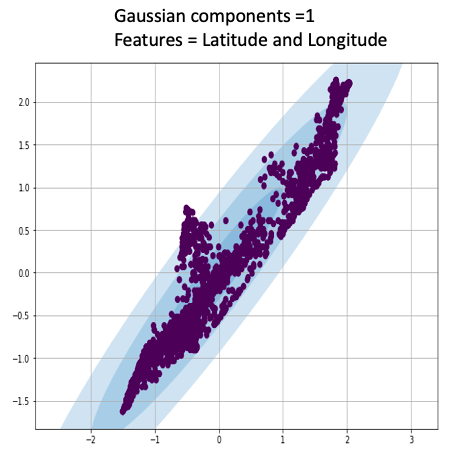
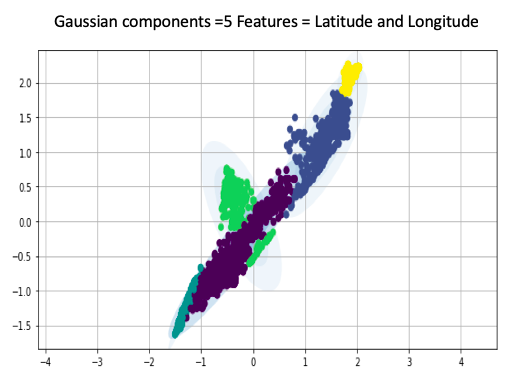
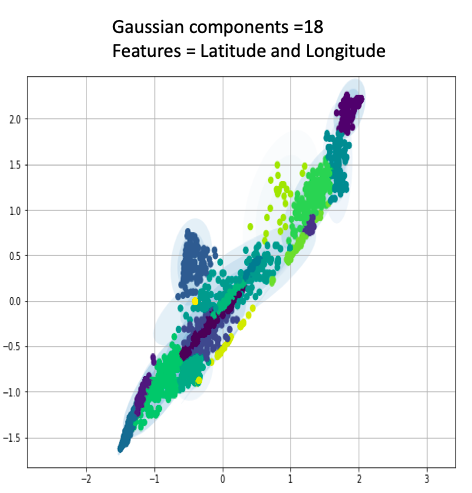
A Gaussian mixture model is a probabilistic model that assumes all the data points are generated from a mixture of a finite number of Gaussian distributions with unknown parameters.
One can think of mixture models as generalizing k-means clustering to incorporate information about the covariance structure of the data as well as the centers of the latent Gaussians.
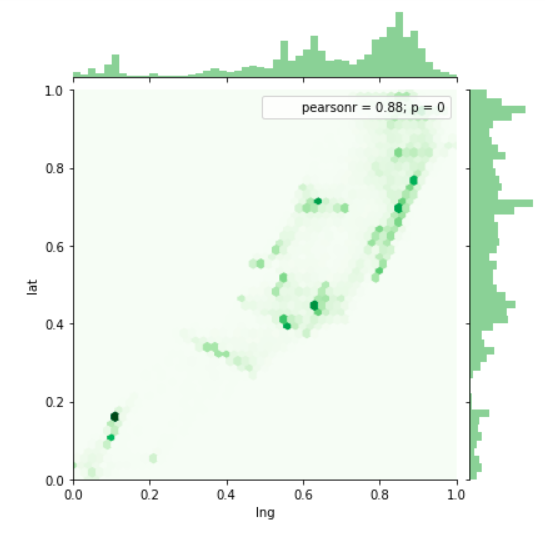
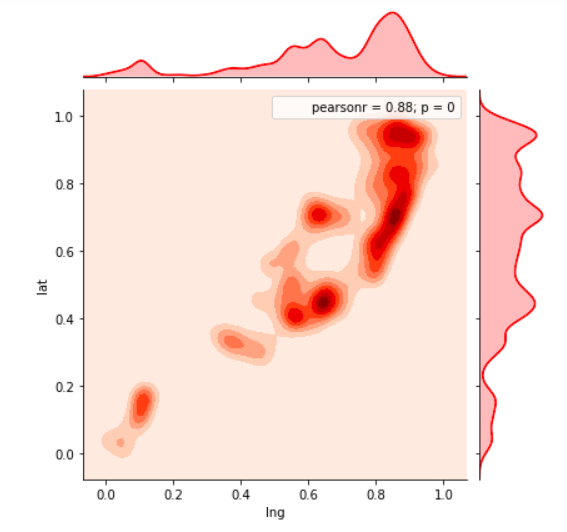
View Visualizations and Results


Team Vectors
About Us
We are Masters student at University of Southern California majoring in Data Informatics. Vectors tells users about its product by describing how machine learning algorithms were used to detect anomalies. The application breaks down different pieces of the project into sections that combine research and implementation, painting a picture in the form of visualizations.
Team
Leadership

Nadir Fathi
CEO, Kiana Analytics
Serial entrepreneur, CEO, and speaker. Leading IoT and Big Data Revolution
nader128@yahoo.com

Anna Farzindar
Professor, USC
Faculty @USC Viterbi Engineering
farzinda@usc.edu

Ashwini Giri
Team Leader
An inquisitive energetic Data Informatics Master's student at USC with a strong foundation in Data Analysis and Python.
agiri@usc.edu

Kathakali Banerjee
Team Member
Data Science/ Android Application/Digital Marketing
kathakab@usc.edu

Laksh Matai
Team Member
Research Assistant at USC CAIS
lmatai@usc.edu

Pallavi Yenigalla
Team Member
Master of Science, Data Informatics, University of Southern California, Los Angeles
yenigall@usc.edu
Team Leader
Ashwini Giri
“I am thankful to our professor Dr. Anna Farzindar and stakeholder Nader Fathi for giving us this opportunity to work on this project. I learned a lot from this exquisite experience.”
Ashwini Giri